These were Canada’s hottest sellers’ markets in June
By Penelope Graham on Jul 19, 2019
What are home buying conditions currently like across Canada? The latest data out from the Canadian Real Estate Association paints a picture of stability, as sales and prices remain relatively unchanged from last year, increasing 0.3% and 1.7%, respectively.
The association’s narrative is that the market has largely absorbed the unaffordability challenges posed by the federal stress test and has returned to balanced territory, meaning there is adequate supply of new MLS listings brought to market to satiate buyer demand.
Buying conditions uneven across the country
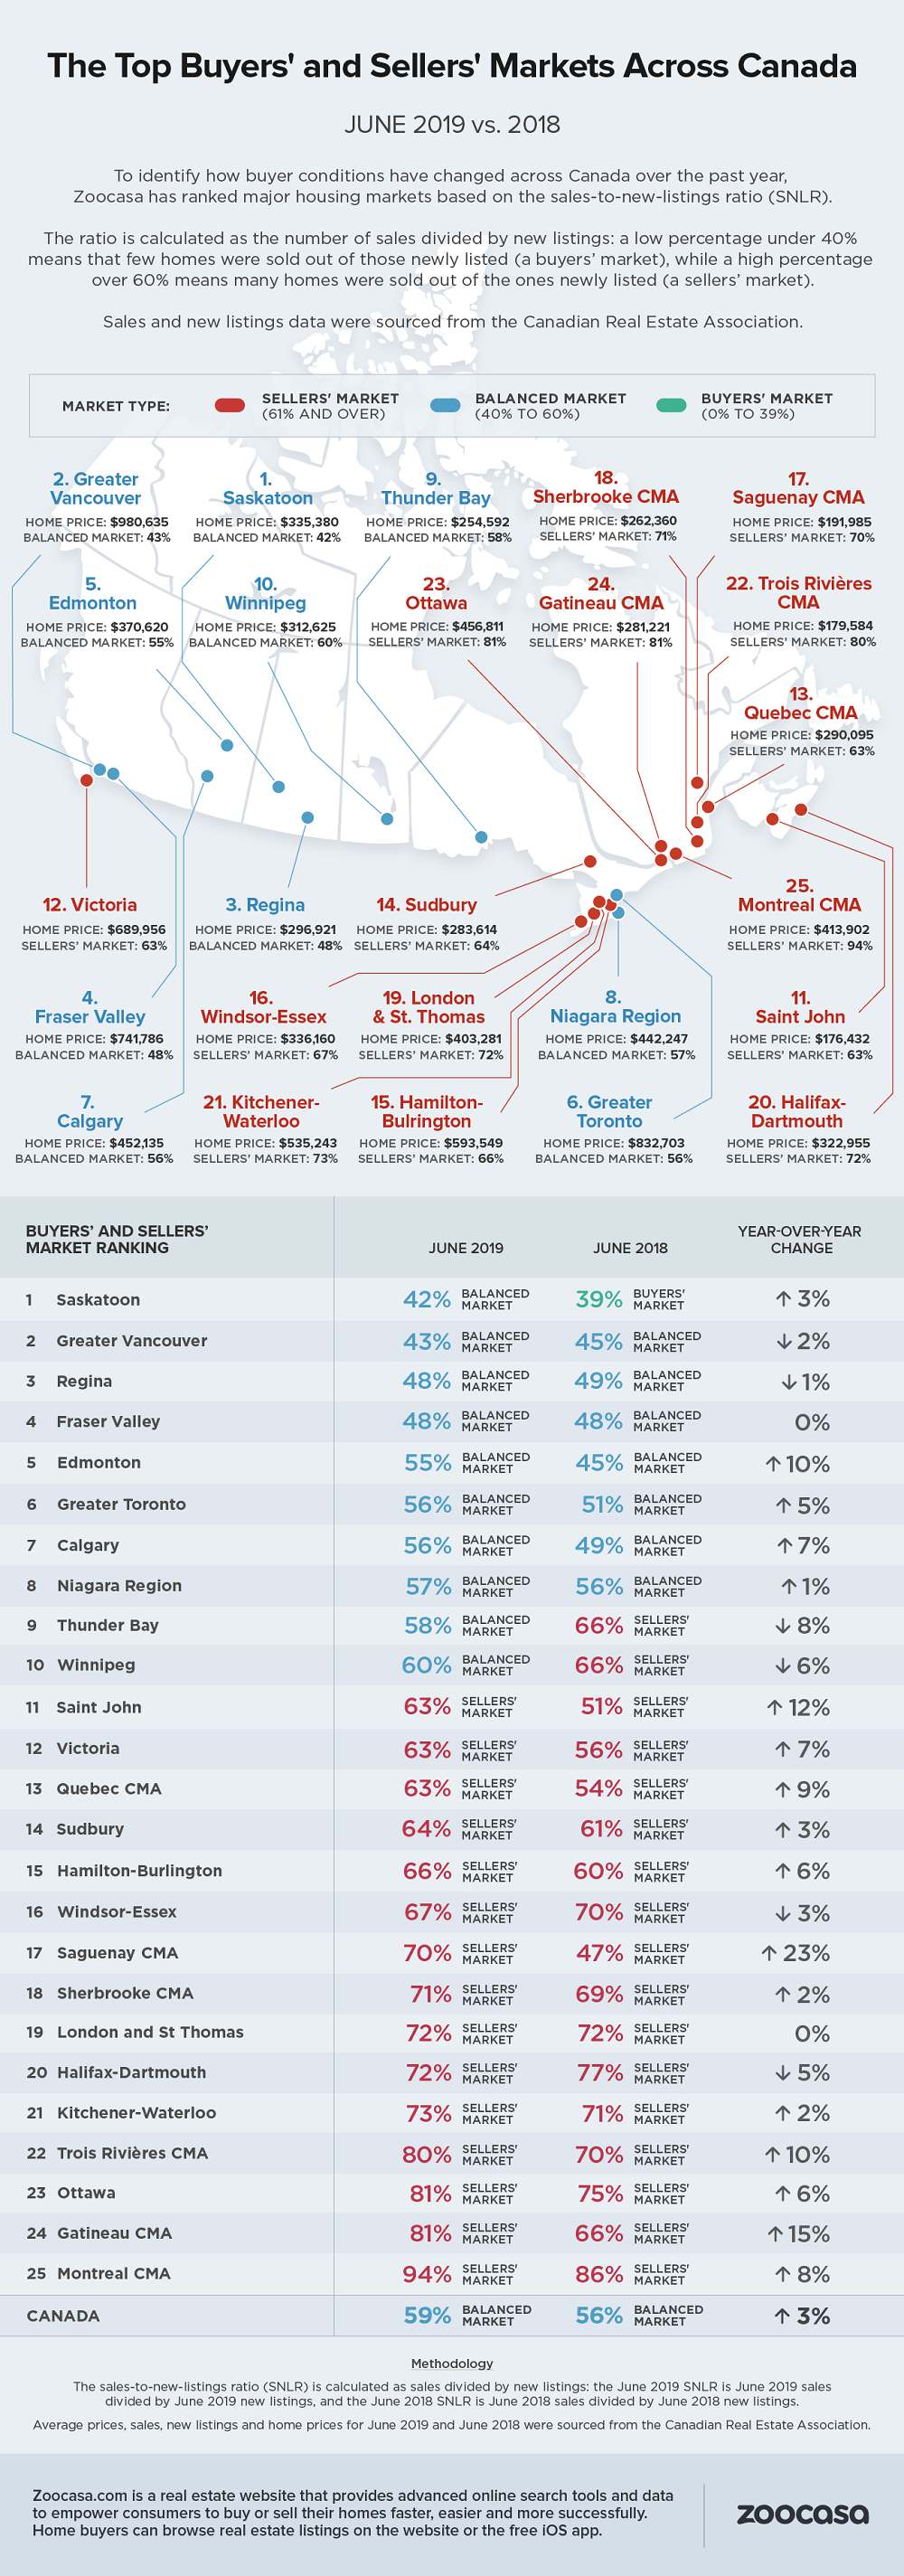
However, CREA emphasized that, at the local level, buying conditions vary widely in markets across the country, with an especially notable gap between the western and eastern provinces. This is further supported by recent data from Zoocasa, which took a look at buyers’ conditions in each of the nation’s 25 major urban centres, and identified which could be considered buyers’, sellers’, or balanced markets in June.To assess buying conditions in local markets, the study crunched the sales-to-new-listings ratio (SNLR) in each. This ratio, which is calculated by dividing the number of sales by the number of new listings over the course of the month, reveals how many newly-listed homes are being sold. A ratio between 40 – 60% means a market can be considered balanced, while below and above that threshold indicate buyers’ and sellers’ markets, respectively.
Only 10 Canadian markets considered balanced
Overall, the numbers, which are based on non-seasonally adjusted data, reveal the Canadian housing market is indeed balanced, though sits on the verge of sellers’ territory with an SNLR of 59%. When drilling down to individual cities, however, only 10 can be considered balanced, while 15 can be classified as sellers’ markets. No major urban market in Canada currently qualifies as a buyers’ market, which would require an SNLR of 39% and below.However, being classified as a sellers’ market doesn’t immediately indicate local homes are more expensive – though if sellers’ conditions persist, that will eventually cause prices to increase.
Rather than directly reflecting affordability, the SNLR is a metric that measures the level of competitiveness among buyers based on supply and demand; for example, a buyers’ market has a surplus of available inventory, offering home seekers ample choice. As a result, they’re less likely to find themselves in multiple offer situations and other scenarios that could put upward pressure on prices. The opposite phenomenon is at play in a sellers’ market; with too few available listings, buyers find themselves competing to purchase the same homes, resulting in bidding wars and rising prices.
Canada’s largest markets now balanced
Greater Vancouver – long notorious for being the most expensive city for real estate in Canada – is now the second-softest market in the country, as buying conditions have relaxed to the lower end of balanced with a ratio of 43%. The market has slowed considerably over the past year with sales plunging by 15%. However, while the average home price has fallen 8.2% in response to flagging demand, it remains at a hefty $980,635 – still financially out of reach for many local buyers.Conditions are considerably friendlier for sellers in the Greater Toronto real estate market, which came in sixth place; with an SNLR of 56%, it can still be considered to be balanced, but a 9.6% increase in sales coupled with a 0.7% decline in new listings has pushed it closer to sellers’ territory, with prices inching up by 3.1% to an average of $832,703.
Prairie markets remain soft
Canada’s top three softest markets also include Saskatoon and Regina, at first and third, respectively, which have also struggled with demand and price growth in the wake of the federal mortgage stress test. Conditions have actually improved year over year in Saskatoon with an SNLR of 42% - pushing the city into balanced territory from 39% in 2018, when it was a buyers’ market. Sales have growth by 3.3% while new listings are down by 4.9%. As a result, the average home price has ticked up by 5% to $335,380.Conditions are more dire in Regina, however, as sales and new listings have both plummeted 17.2% and 16.2%, leading to a 6.4% drop in the average sale price to $296,921.
Check out the infographic below to see which housing markets were most and least competitive in June, and how they compared to the same time period in 2018.
Penelope Graham is the Managing Editor at Zoocasa.com, a real estate website that provides advanced online search tools and data to empower consumers to buy or sell their homes faster, easier and more successfully. Home buyers can browse current real estate listings in markets across Canada, including Toronto, Calgary, and Vancouver MLS, as well as view past sold prices in Toronto, via the website or the free iOS app.